A Vaccination Simulation
During some rare spare time, I began to think. When discussing vaccination, proponents like to point out how Herd Immunity helps those who can’t vaccinate. I wondered if there was some visual way of showing it. (I know Penn and Teller did a video recently, but I haven’t watched it yet.) For some reason, one of my old computer programming assignments, The Game of Life, came to mind.
The Game of Life is a simulation where each square represents one "cell" of life. The cells will multiply or die based on certain rules. They might blossom into a vast colony, die on the vine, or even move around the board (spawning new cells in the front and having old ones dying off behind).
I resolved to make a Vaccination Game of Life or, for a more descriptive and catchy name, a Vaccination Simulation. Fast forward through some programming, testing, great advice from Phil Plait (thanks, Phil!) and here it is: http://www.techydad.com/Vaccinate/
Just set some parameters like how deadly the virus should be, vaccinate some people and then let loose the plague. Will all of your people die? Will some recover? Will the virus spread to everyone or fizzle out? Will Herd Immunity protect the unvaccinated?
What about Herd Immunity? I had set out to test this and test it I did. I ran 5 different scenarios: a 0% vaccination rate, a 25% vaccination rate, a 50% vaccination rate, a 75% vaccination rate and a 90% vaccination rate. For each scenario, I ran the simulator 3 times and took the average number of dead and recovered. Then, I figured out the death rate (defined here as Number Who Died / Number Who Got Sick).
Here are the results:
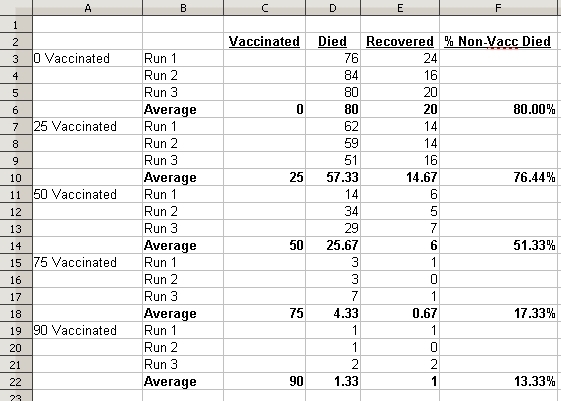
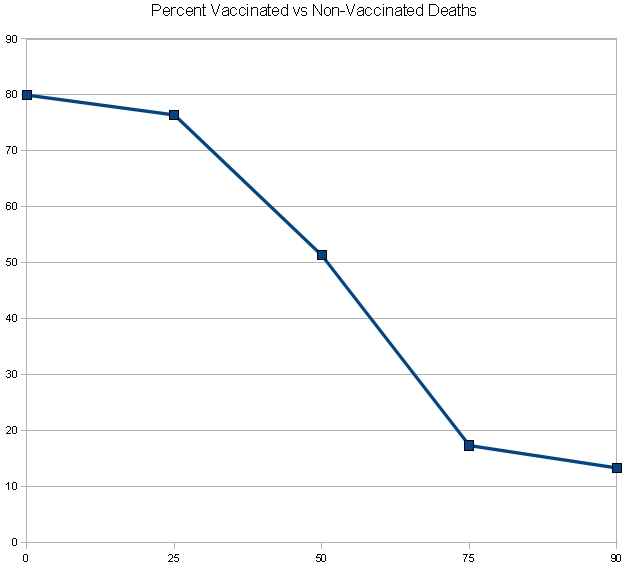
Note that the Death Rate (on the chart labeled as "% Non-Vacc Died") declined as the vaccination rate rose. For the more visual, here it is in graph format.
What does this mean in human terms? Let’s take 5 people and put them in 5 different communities. For whatever reason, these 5 people can’t recieve the vaccination for The Virus. The person in the 0% vaccination group would stand an 80% chance of dying. The person in the 25% group would stand a 76.44% chance. And so on to the person in the 90% vaccination group who would only stand a 13.33% chance of dying. The people have the same immunity, but the vaccinated people around them reduces the spread of the virus and makes it less likely that they’ll contract it. Less likelihood of contracting the virus means less likelihood of dying from it. Herd Immunity in action.
Now go off and enjoy Vaccination Simulation for yourself whether to educate or just to mercilously kill a hundred square representations of people.